B2B Vertical Marketplace Take Rate Benchmarks
B2B marketplaces operate under different economics than consumer ones, requiring new benchmarks.

The take-rate benchmarks usually cited across marketplaces trace back to consumer-facing and C2C platforms, the sort that fill investor decks and trade coverage. Out of twenty-five marketplaces in a popular graphic, only EZCater plus Upwork count as B2B platforms among the twenty-five. An investor looking for a take-rate "market rate" benchmark is nearly always grabbing one consumer metric and applying it to any business that operates differently. Swapping in that substitution stands as the biggest repeated error when people price B2B marketplaces.
That gap didn’t happen because of coverage. Most B2B marketplaces keep their numbers hidden, work within categories that skip the news cycle, and don't get enough notice to generate benchmark data. Before anyone looks at the figures, a framework for making sense of them calls for rebuilding, since this consumer playbook simply isn't meant for this. It misleads.
The structural features of B2B procurement that compress take rates by design
B2B procurement has distinct structural features compared with consumer buying, while each one pushes take rates its own way. Mess up the order and any later check falls apart.
Companies vet suppliers for rules, payment conditions, ERP integration plus liability risks. Vetting creates friction, making it pricier to move between platforms and shrinking what a marketplace can take per transaction. Buyers plus suppliers need transactions sent directly into their source-to-settle tools and their order-to-cash tools. When a marketplace just does discovery, matching a buyer to someone before stepping away, the value it captures is much smaller than what one sitting inside a transaction workflow gets.
Bigger ticket sizes carry real weight here. When average order value climbs higher, a big percentage fee turns into sticker pain. The ACV Auctions fee schedule charges over 20% on transactions below $2,000, or 3% and under once a transaction crosses a higher threshold. Here, an inverse link of order size to take rate appears in an actual, disclosed fee schedule rather than a made-up model. Unlike consumer sales, B2B deals rely on ongoing ties and agreements that are negotiated, shrinking the value from matching that any marketplace offers and what it can ask in return.
All four forces boil down to a depth-versus-breadth choice. Hooking up with a buyer's procurement workflow earns a bigger take rate, yet that narrows the buyers any platform can handle, because integration eats hours, developer work, and confidence not every buyer gives freely. By controlling the entire source-to-settle workflow, a platform captures more on each transaction, but it handles fewer accounts. In B2B, a higher Take rate means a smaller addressable market. You rarely see this among consumer marketplaces, since growing bigger plus monetization usually reinforce one another rather than clash.
The six dimensions that actually determine where a B2B marketplace lands on the take-rate spectrum
This framework draws on reviewing roughly 60 B2B marketplaces, finding six linked dimensions pushing take rate higher or lower. Each one matters on its own, but combined they account for nearly every figure in this market, while skipping even one is how investors mis-price any platform.
The starting point is Matching difficulty. Standardized goods carry little friction for buyers, so take rates get pushed down. Take rates go up for hard-to-search goods, because any marketplace creates extra value when items are tough to explain or match up. Another dimension is Process depth: discovery-only platforms including Capterra, G2, and ILSMart are typically put at 1% or less, since they monetize views, not results, but platforms owning the whole transaction rank high.
Principal role, that dimension, holds one of the framework's key levers, though it is underrated more than any other. When a marketplace only plays facilitator, it earns lower fees than one serving as vendor, picking the cost, assuming liability, and even hiding the actual supplier from each buyer. Taking on that vendor role moves the economics further than anything else a platform does. The next dimension is how you handle money: holding payments on-platform boosts take rates and lets you earn extra revenue from longer financing options, whereas off-platform flows give that value away to lenders and processors.
The next dimension is Average order value, matching ACV Auctions fee schedule pattern: in high-AOV categories, percentage take rates compress, while low-AOV categories allow ones that are higher, and both usually end up roughly equal in cash. Buyer and seller fragmentation across the market is another dimension. When suppliers and buyers alike remain scattered, discovery adds meaningful value, so the take rate can run higher. In a market that's concentrated, with ties already set, value shrinks quickly.
No single dimension sets the take rate, so any platform facing high matching difficulty while handling off-platform payments plus a high AOV might still wind up somewhere average. This framework maps the six dimensions that shape observed take rates. The error worth naming is treating it as a forecast: it describes where platforms land, not where they must end up.
What the confirmed take rates of named B2B platforms actually show
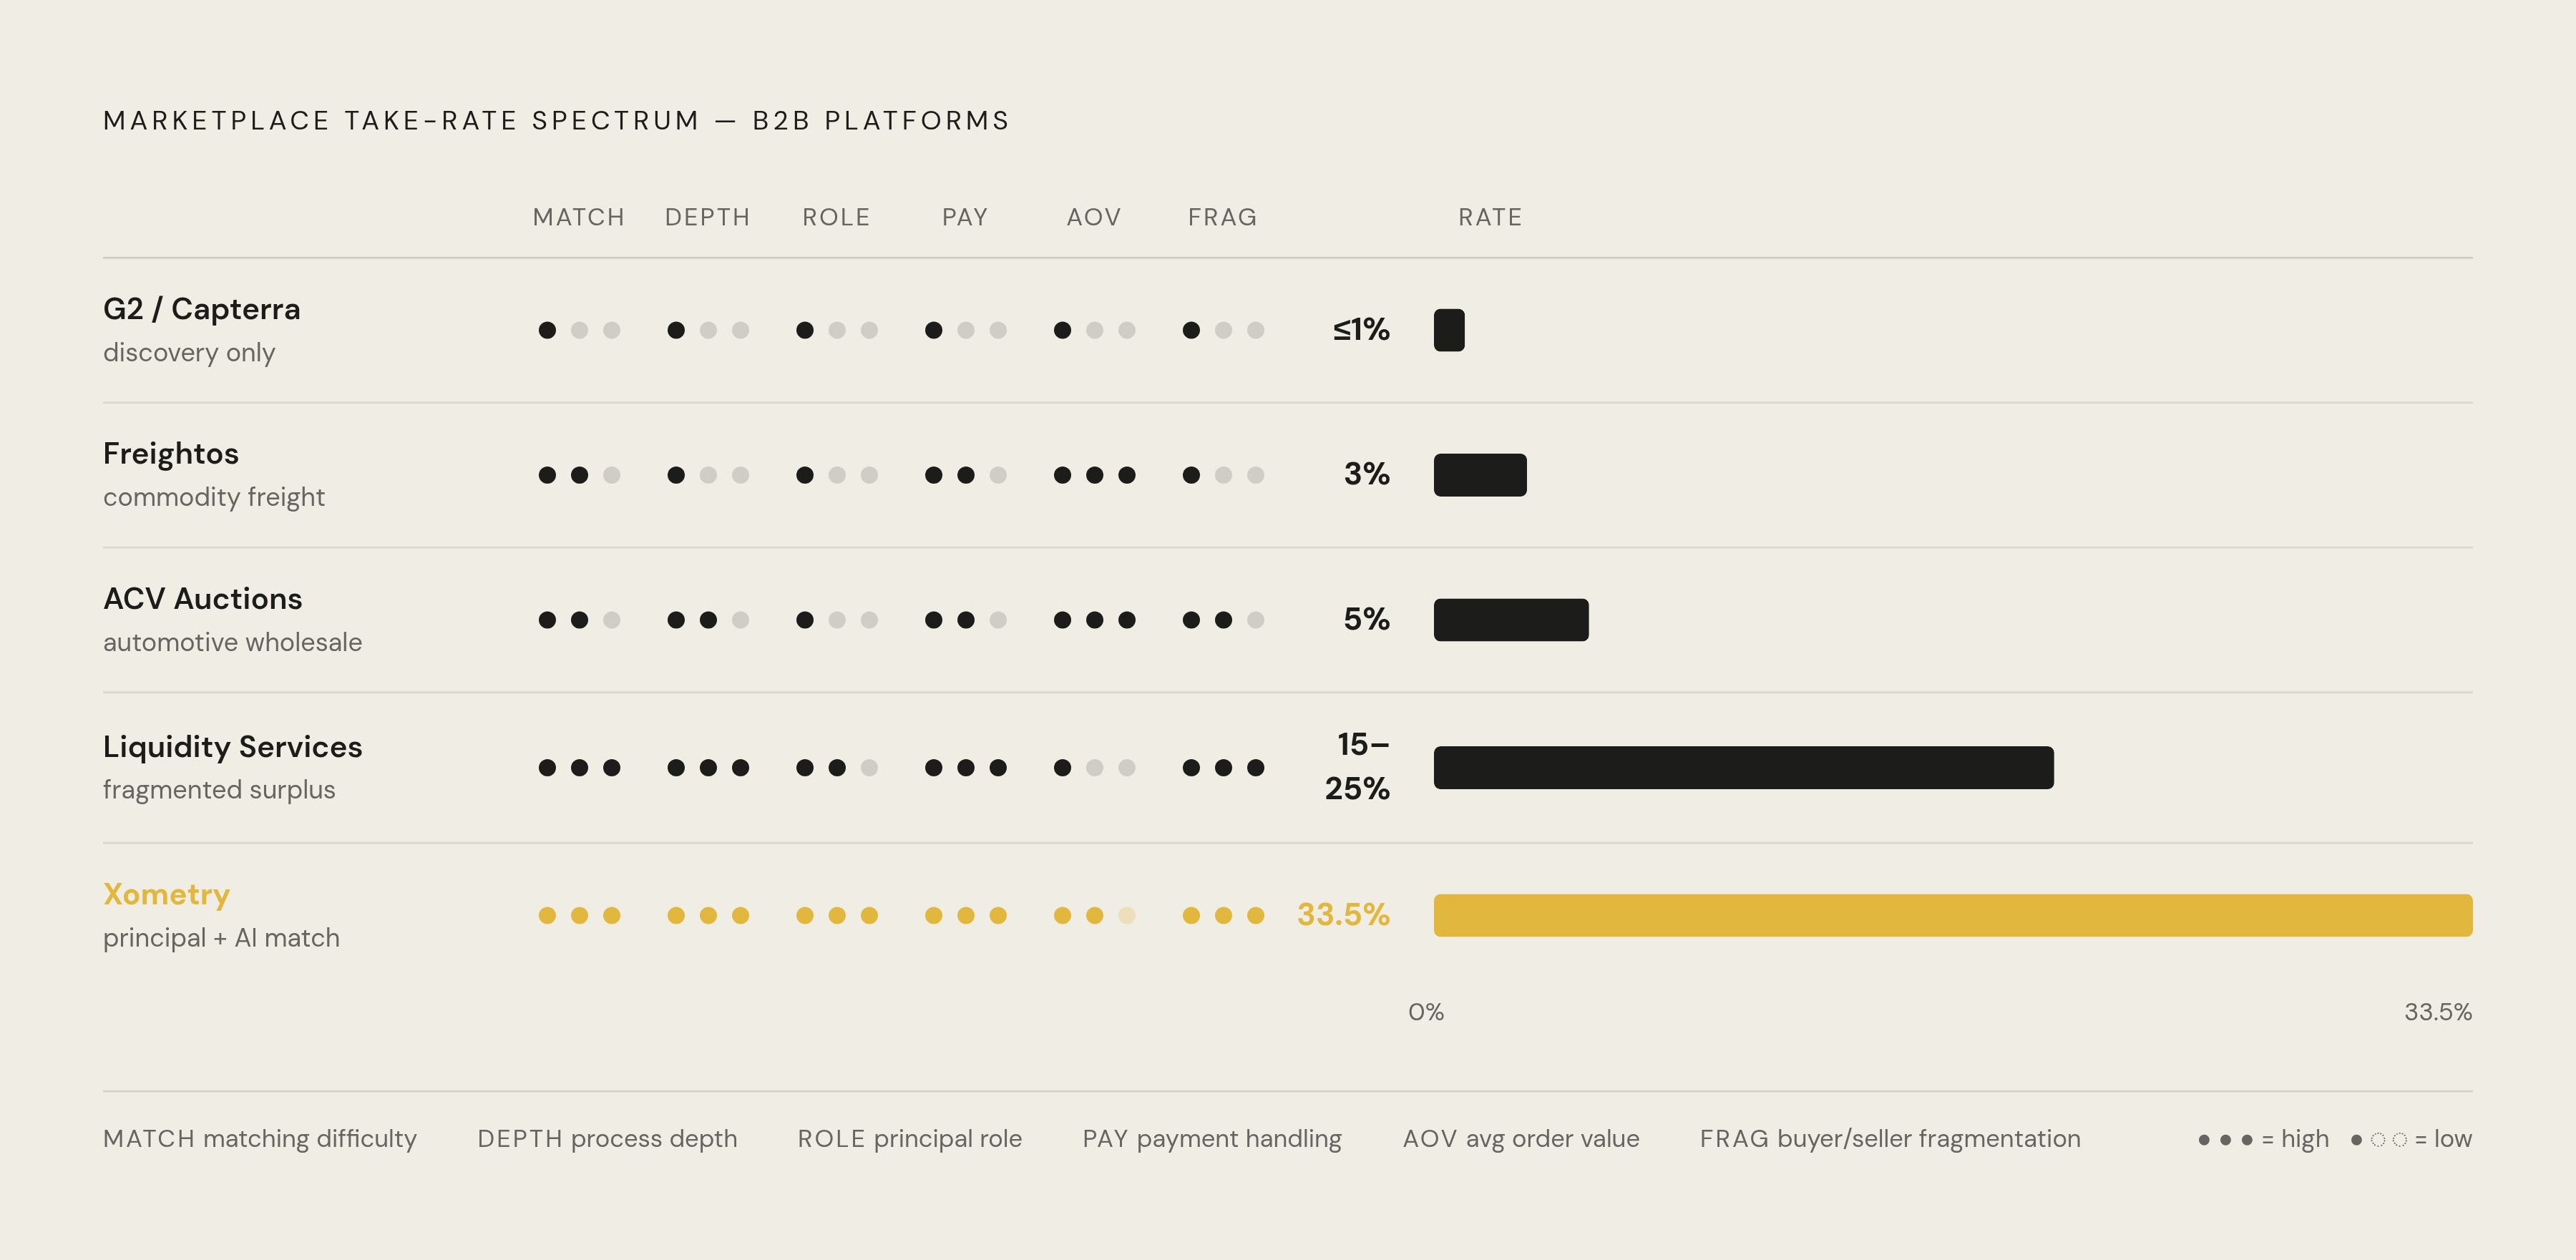
Among confirmed, disclosed B2B platforms, the range stretches from roughly 1% up to 33.5%, a gap worth sitting with on its own. Nobody who checked real platforms would be quoting a "market rate" to describe B2B take, because none can exist.
Xometry's on-demand parts platform booked a 33.5% gross margin as its working take rate in Q2 2024. That quarter brought record revenue of $133 million, up 19% year over year, with marketplace revenue of $117 million, up 25%. Xometry is functionally a principal reseller: it gives AI-generated pricing before bringing the work to its supplier base. By Q4 2024, existing accounts produced 97% of the marketplace revenue, while those paying $50,000 or more each year rose 12% over the prior period. It's a complex, tightly run operation keeping a high take rate via retention rather than endlessly chasing fresh buyers.
Liquidity Services and similar platforms fall between 15% and 25%, reflecting how hard matching is with fragmented sources, yet with lower process depth compared to Xometry. ACV Auctions, moving roughly $10 billion in automotive wholesale volume, implies a take rate near 5%, consistent with a standardized asset class, high order values, and that steeply tapering fee schedule. Freightos, which handles freight, implies its take rate sits near 3%, one commodity-adjacent category in which high order values plus fulfillment beyond the platform both limit process depth. Discovery-only platforms like G2, Capterra, and ILSMart typically sit at or below 1%, since those sites monetize ads and contacts, not transactions.
The spread means something. Those six dimensions explain it: Xometry rates high for difficulty in matching, the principal role, and depth of process, while Freightos operates in a different segment. Because Manufacturing's supply base is fragmented and regionalized, Xometry has kept an effective take rate of nearly 20% on that facilitated slice of its business, a helpful benchmark for a complex-goods platform that hasn't yet claimed merchant-of-record status itself. One caution, though: since Xometry sits as the actual seller of record, its reported figure is gross margin, and lining that up directly against a facilitated marketplace's percentage overstates the gap between them.
How GMV-based valuation frameworks obscure take-rate quality in B2B marketplaces
People reach for gross merchandise value as the quick label measuring marketplace size, yet it hides what really drives revenue. When take rates differ, marketplaces sharing the same GMV generate wildly different revenue plus wildly different economics, something GMV by itself can't reveal. If you're still putting GMV first for B2B buyers, you're tracking the thing that matters least.
Variance across valuation multiples is stark. Research into marketplace multiples shows a gap of 13x across GMV-based as well as revenue-based figures, versus just 2x when tied to gross profit. On gross profit, the variance is far smaller, and the gap in itself should decide which metric gets the emphasis. This is partly structural: marketplaces facilitating the same transaction size can show different GMV as an intermediary, a connector, or a buyer-reseller role, making cross-platform comparisons clearly unreliable.
The wider market is already correcting for this. In 2025, Marketplaces hit a typical 2.3x EV/Revenue valuation, far under the 5.6x long-term average, and this reset moved buyers toward unit economics instead of GMV multiples. Meanwhile, marketplaces that are AI-integrated now command a 30% to 50% valuation boost at the pre-seed level in 2025, and this matters here, because B2B platforms with the highest take rates, Xometry above all, run AI-enabled matching systems, not static directories.
A B2B marketplace with a 5% take rate on a large GMV base isn't weaker than one charging 20% on a smaller base. Using only the percentage as your scoreboard flips the comparison. What counts is gross profit, the stickiness of retention, and if the take rate can hold up under buyer pushback.
The market context that makes B2B vertical take rates a more consequential number than they were five years ago
The B2B ecommerce market is estimated at $28.03 trillion in 2026, up from $24.08 trillion in 2025, with Grand View Research projecting it reaches $105.85 trillion by 2033 at a 20.9% compound annual growth rate. U.S. B2B ecommerce site sales grew 10.5% year over year in 2024 to $2.297 trillion, per eMarketer, a fraction of the global figure that shows just how early digitization of B2B procurement still is.
The category where confirmed B2B take rates run highest, manufacturing, made up 24% of the B2B ecommerce market in 2024, the biggest tracked slice of any one sector. The health and medical category is rising the most, with projected 21.1% CAGR until 2030. Specialized marketplaces are growing at a faster rate than general platforms, so the argument for depth rests on more than any one take-rate comparison shows.
Money came next. Investor focus moved to B2B near 2022 and has risen again by 2025; B2B platforms claim a record 20% slice of the marketplace space during 2023, per Adevinta and Dealroom. First-round funding thresholds have risen too. Colin Gardiner's 2025 marketplace fundraising analysis puts the net revenue threshold above $2 million annually, trending toward $3 million with strong growth and solid unit economics, a 75% jump from the previous benchmark of roughly $1.4 million. Add up that size, the upside in vertical markets, plus tightened fundraising requirements, and your take rate isn't some back-of-envelope guess anymore. It's what tells you if a B2B marketplace can clear that gate for big investor money at all.
How AI-powered buyer behavior is beginning to reshape where B2B marketplace value is created, and what that means for take rates
According to Forrester's 2026 State of Business Buying research, close to 94% of buyers apply AI somewhere during their purchasing process. Discovery, shortlisting now take place inside AI-powered interfaces ahead of any buyer landing on a marketplace. A 2024 Digital Commerce 360 report shows 59% of B2B buyers finish over a quarter of their deals on marketplace platforms, yet the path leading them there keeps moving right beneath that figure.
In November 2025, Alibaba launched AI Mode, adding natural-language search discovery with supplier comparison inside procurement. One of the biggest B2B platforms shows AI belongs inside matching layer work rather than getting bolted on like some chatbot.
This lands across that matching-difficulty dimension, which underpins much of B2B's take rates, and each platform with pricing that rests on discovery should be concerned. When AI lowers what it takes to locate and weigh suppliers, platforms that charged a high take rate only for discovery value will see compression. The value must shift somewhere different: upstream to curation and verification, or downstream to transaction handling and payments. When Buyers lack confidence in the outputs from AI, they look to places they already rely on for validation, forcing B2B marketplaces into spending on verifiable supplier content plus credentialing so they can remain the layer that is authoritative during buying.
Here, AI visibility, also shorthanded GEO/AEO, connects with business results in B2B marketplace platforms. One platform appearing in AI-powered procurement research gains structural ground in winning buyers that wasn't possible in a search-engine-only era. Getting recommended by an AI tool is starting to fill the role that the top Google spot once did. Platforms funding content that is structured, verifiable, AI-legible, and earns citation within generative results, defend value at the discovery-layer behind their matching edge, and in turn, defend their take rate.
What a defensible B2B take rate requires to hold over time
A high take rate on day one doesn't make a business solid, no matter what the sales slides suggest. It may simply come from initial pricing strength as it erodes when buyers grasp the market, or a new competitor brings lower friction at a lower cost.
Xometry's figures reveal real durability: retention of 97% revenue across existing accounts, plus a 12% year-over-year rise among high-spend ones. It shows the platform has grown embedded in procurement workflows that recur, not merely strung transactions of the one-off kind.
Certain features keep a take rate durable, with process depth leading them: buyers skip any discovery layer easily, but not a marketplace woven into order-to-cash or source-to-settle workflows. Another is Merchant-of-record status, as taking on liability and acting as the vendor builds change barriers a facilitator cannot replicate. They count as well. Xometry's closed-loop AI uses each finished transaction to keep sharpening its pricing, plus lead-time prediction and better sourcing. Transactions feed the AI, the AI improves, and smarter AI draws more buyers and suppliers in, locking the platform in that much more. Verified supplier content, along with credentialing, completes the picture, as platforms with structured, citable supplier information retain strong visibility when AI discovery leads procurement in B2B.
Sitting with the vertical SaaS comparison is worth it. Vertical SaaS vendors usually earn revenue at below 1% on the transaction value they handle, and have watched marketplace economics unfold from afar for years with envy. Now the danger flips: when marketplaces remain parked at that discovery layer, they drift toward subscription-style revenue without gaining subscription-style retention. Take rate ultimately reflects the amount of verifiable, trust-building value any given platform produces downstream. AI visibility systems exist to prove and defend this.